
Welcome to my next blog post with a deep dive into the depths of Azure Network Watcher. This post will discover the powerful features and insights this tool offers to optimise and monitor your network performance like never before. Let’s explore the functionalities that can help you troubleshoot issues, analyse network traffic, and ensure the robust security of your Azure environment. Get ready for an enlightening journey into the world of Azure Network Watcher!
I will write a series of blog posts about Network Watcher. The first post will focus on its functionalities, along with how to enable and monitor its features. The remaining features will be discussed in another blog post.
What is Azure Network Watcher?
Azure Network Watcher is a powerful and comprehensive suite of tools designed for the effective monitoring, diagnosis, and management of Azure resources connected with Azure Virtual Network resources. This robust Platform empowers customers to gain insights through real-time network metrics, troubleshoot connectivity issues swiftly, and analyse intricate network traffic patterns.
With Network Watcher, customers can thoroughly assess the health and performance of various resources, including virtual machines (VMs), virtual networks (VNets), application gateways, and load balancers. The tool enables you to enable or disable logging for these resources, providing a means to track performance trends and diagnose issues effectively.
How to Enable Network Watcher?
Azure Network Watcher is a regional service that allows customers to monitor and diagnose network conditions in Azure. It provides scenario-level monitoring for end-to-end network issues. To use Network Watcher, you need to create an instance in your desired Azure region, which enables its capabilities there.
By default, Network Watcher is automatically enabled when you create or update a virtual network, without affecting resources or incurring additional charges. If you opted out of this feature, you must manually enable Network Watcher in each region where you wish to use it.
The Network Watcher instance can be created using the Azure portal, PowerShell, Azure CLI, REST API, or an Azure Resource Manager (ARM) template.
- Log in to the Azure portal and choose the Network Watcher services.
- On the Add network watcher, select your Azure subscription, then select the region that you want to enable Azure Network Watcher for. Click Add.
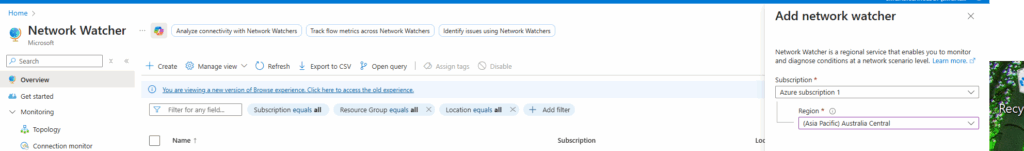
Note: When you create a Network Watcher instance using the Azure portal, it is automatically named NetworkWatcher_{region}, matching the region (e.g., NetworkWatcher_australiaeast for Australia East). The instance is placed in a resource group called NetworkWatcherRG, which is created if it doesn’t exist. You can customise the names using PowerShell or REST API methods while creating Network Watcher.
Network Watcher Services
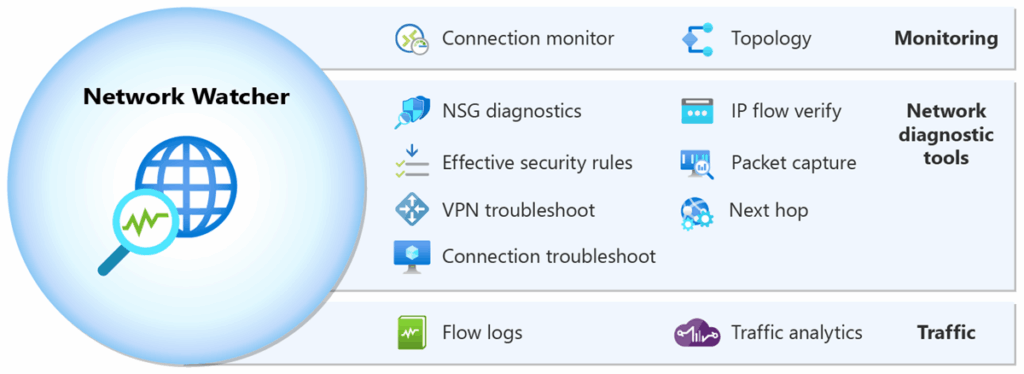
The network watcher encompasses three primary sets of tools and capabilities that enhance the management and monitoring of network infrastructure:
- Monitoring: This feature allows administrators to oversee the health and performance of their networks in real-time. It includes capabilities such as performance metrics tracking, alerts for anomalies, and visual representations of network traffic trends, ensuring that potential issues are identified before they escalate.
- Network Diagnostic Tools: A suite of diagnostic tools enables users to troubleshoot and analyse network problems effectively. This includes functionalities like connection troubleshooting, packet capture, and IP flow verification, which assist in identifying bottlenecks, misconfigurations, or connectivity issues across various network segments.
- Traffic Analysis: This capability provides insights into the flow of data across the network, allowing for a deeper understanding of bandwidth usage, application performance, and user behaviours. Detailed reports and visualisations help optimise network resources, manage congestion, and ensure compliance with bandwidth policies.
Together, these tools create a comprehensive framework for maintaining and optimising network operations, helping organisations ensure reliability and performance in their digital communications.
Network Watcher – Monitoring Services
Network Watcher – Monitoring services includes two essential monitoring tools designed to help monitor and manage your resources effectively:
- Topology:
The Topology tool provides a comprehensive visualisation of your entire network, enabling a clear understanding of your network configuration. It features an interactive interface that enables you to view resources and their interrelationships across multiple subscriptions, resource groups, and geographic locations within Azure.
Visit the MS page for the list of Azure Network topology supported resources.
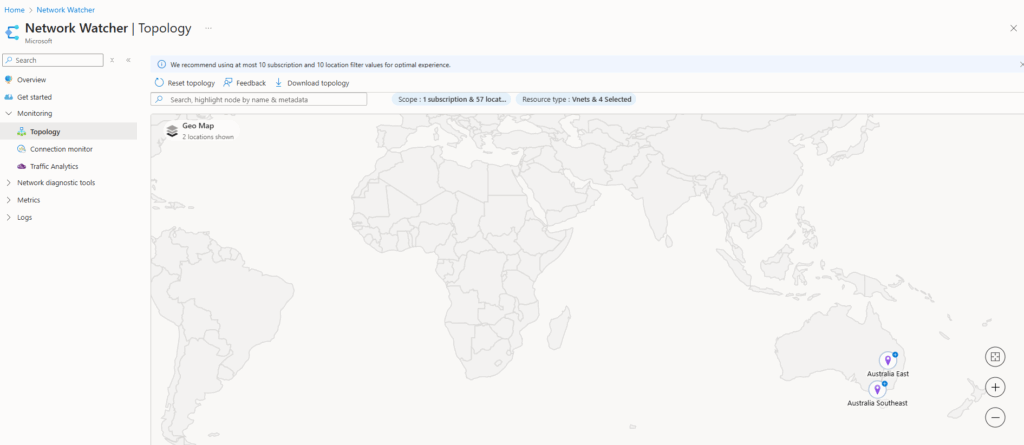
To view the network topology, click on Azure network watcher services.
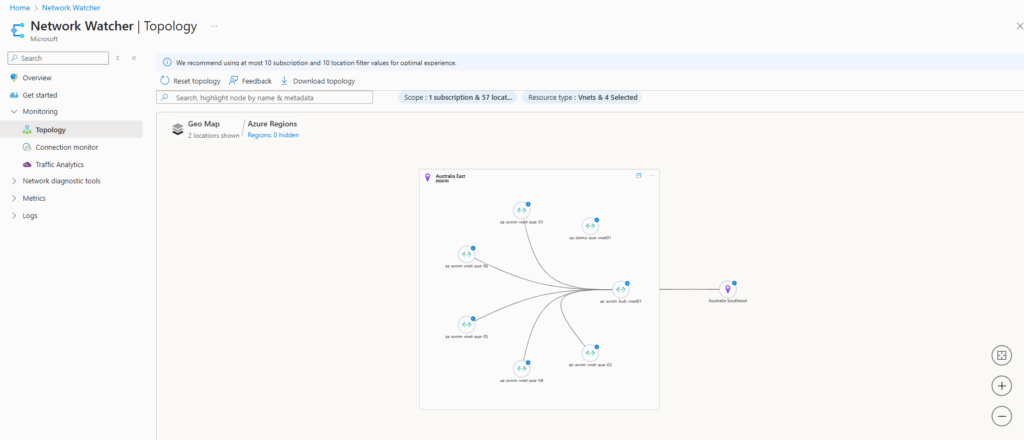
- Select Network Watcher and click on Topology under the monitoring section. You will see the Azure regions where you have created virtual networks. In my subscription, I have resources created in the Azure Australia East and Australia Southeast regions.
- We can choose to select the scope for your network watcher topology, including subscriptions, regions, and resource groups. To change the scope, click the scope and choose your desired scope.
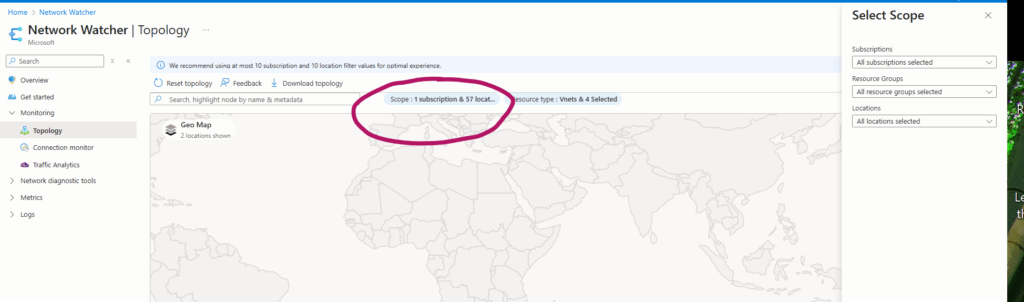
- To view the topology of the selected scope, click on the region. Additionally, you can download the topology view as a file with the .svg extension.
- To drill down the topology, I have set a scope as my testing subscription and selected the plus sign of the region that has the resource that helps to navigate the view.
- In the picture below, you see virtual networks and connected Azure resources in the region. You see any virtual network peerings in the region so that you can understand the traffic flow from & to resources within the region.
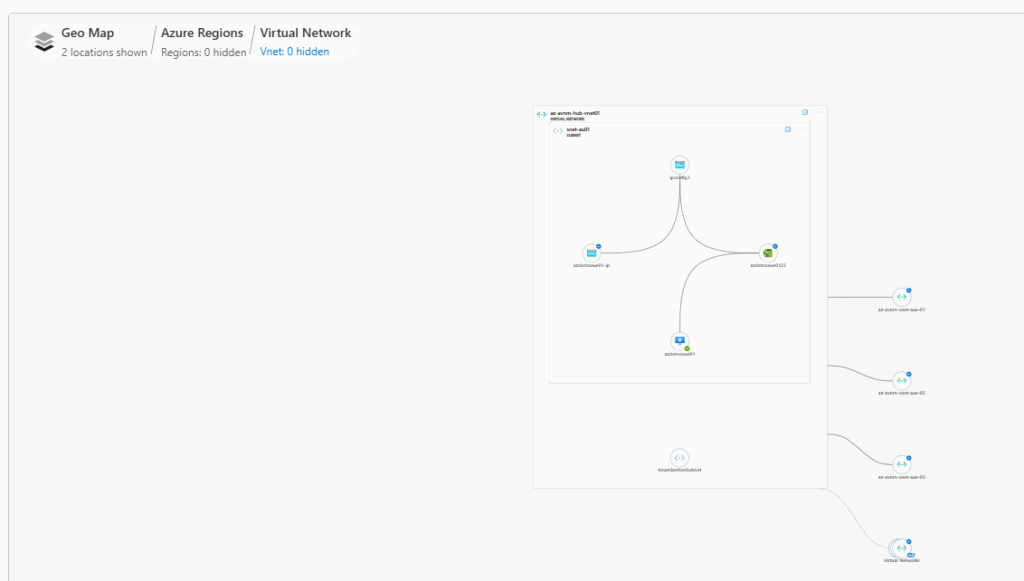
- Then we can navigate to the virtual network view to see its subnets and its resources.
- In my subscriptoin, the below image shows the VM and its resources attached to the hub vnet.
2. Connection Monitor:
The Connection Monitor tool provides robust end-to-end connection monitoring for both Azure and hybrid endpoints. Connection monitor offers continuous network connectivity monitoring, allowing users to detect anomalies and troubleshoot issues in Azure and hybrid cloud environments. It measures packet loss and latency across TCP, ICMP, and HTTP pings.
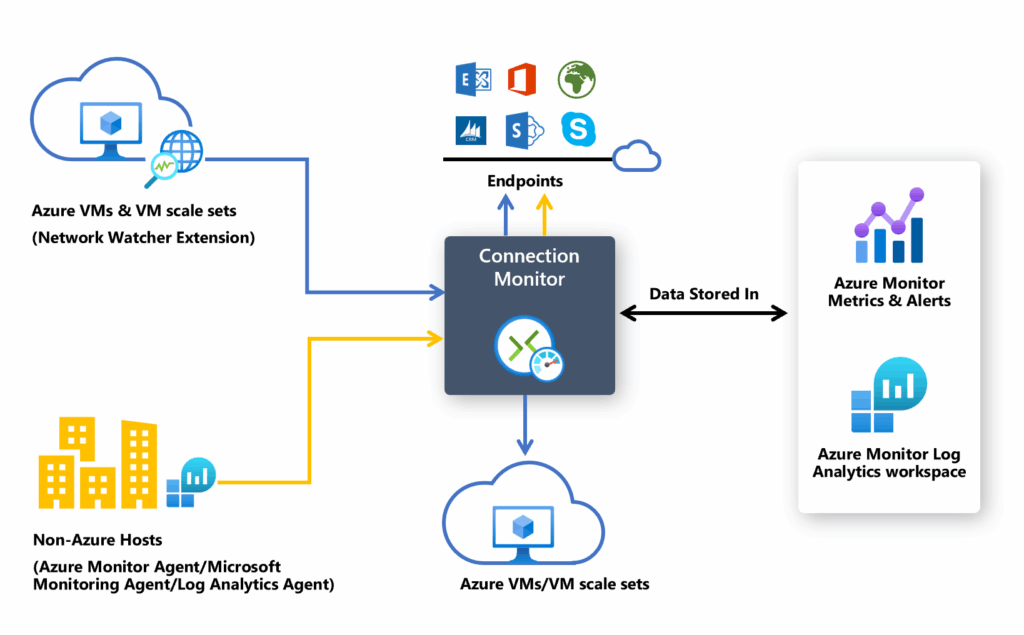
A unified topology visualises the end-to-end network path, highlighting performance metrics for each hop. The connection monitor delivers actionable insights and detailed logs for efficient root cause analysis.
Note: Connection monitor uses small executable files to check connectivity. It can perform checks from both Azure and on-premises environments. The type of executable file you need depends on whether your virtual machine is in Azure or on-premises.
The connection monitor helps to solve some real uses cases for customers and the examples list are :
- Evaluate latency between your on-premises site and an Azure resources (IaaS and PaaS) for a hybrid application.
- Check connectivity between a front-end web server and a database server in a multi-tier application.
- Measure network latencies by having VMs in the two or more different Azure regions.
To Create the connection monitor, follow the below steps:
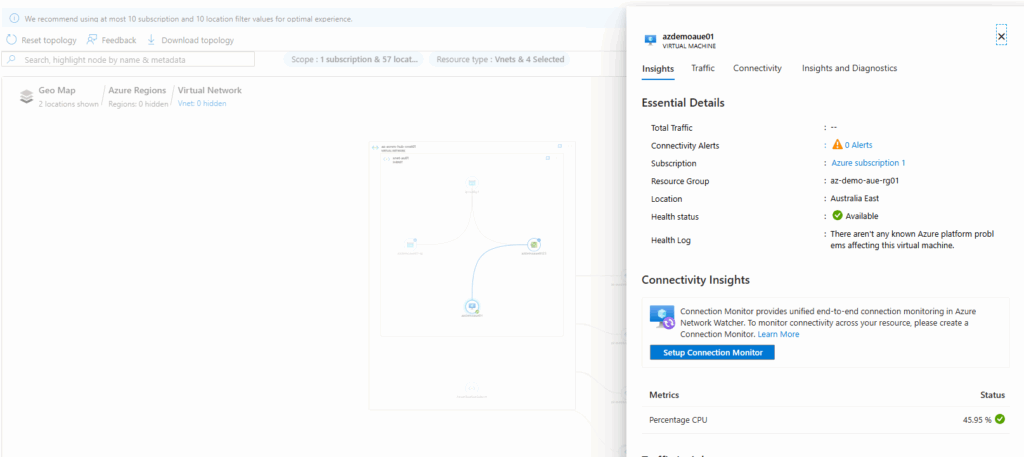
- Use the network topology to drill down the resources which needs connection monitor. Another options, click on the Network watcher and select the connection monitor under monitoring section.
- In the next tab, provide the required information as subscription , region and name for Connection Monitor. Click Next.
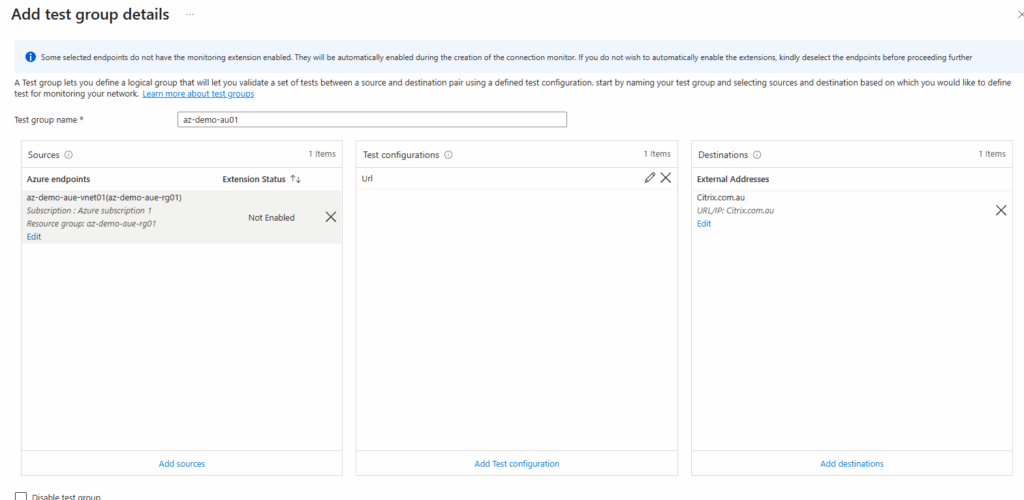
- Under the test group tab, choose your source VM or endpoint and choose the destination endpoints. for my testing, let me choose VM as the source and external endpoint (website) as the destination.
- The next step to choose the log analytics workspace and we can custom as needed.
- The next section, we can create the alerts as needed from the connection monitor test results.
Once you have completed all the steps, the process will proceed to enable uniform monitoring extensions for all endpoints that do not have monitoring agents activated. The creation of the connection monitor will follow this.
After the creation process is successful, it typically takes about 5 minutes for the connection monitor to appear on the dashboard.
In the second blog post of this series, I will explore the remaining features of Network Watcher. This tool offers valuable insights and functionalities that enhance network management and monitoring.

Santhosh has over 15 years of experience in the IT organization. Working as a Cloud Infrastructure Architect and has a wide range of expertise in Microsoft technologies, with a specialization in public & private cloud services for enterprise customers. My varied background includes work in cloud computing, virtualization, storage, networks, automation and DevOps.